Upon starvation, individual amoebae of the micro-organism Dictyostelium discoideum start to aggregate and form migrating multicellular slugs. During the slug stage prestalk cells group in the anterior part of the slug, whereas prespore cells end up in the posterior part. Each slug culminates in a fruiting body consisting of a globule of spore cells on a slender stalk. The motion of amoebae is orchestrated by waves of cAMP, which are formed by a combination of a pulsatile cAMP excretion and a cAMP-mediated cAMP response. This is accompanied by a chemotactic response towards cAMP.
Migrating slugs are orientated by light (phototaxis), temperature gradients (thermotaxis), pH differences (acidotaxis), and wind (rheotaxis). The orientation towards light (as well as towards the other cues) leads to migration towards the soil surface, which is beneficial for spore dispersal (Bonner et al., 1985).
A slug starts to turn towards a light source after 10 minutes of irradiation by light coming from one side (Yumura et al., 1992). Phototaxis and thermotaxis must use different pathways, because even light intensities too low to cause a local increase in temperature elicit a response. During phototaxis the slug functions as a lens that focuses light on the side opposite to the light source. This so-called `lens-effect' was first postulated by Buder (1920) for Phycomyces, and was shown by Francis (1964) to be the mechanism in Dictyostelium (see also Poff et al., 1986). Several researchers have confirmed this lens-effect by, for example, illuminating only half of the slug (Francis, 1964), placing the slug in mineral oil (Bonner & Whitfield, 1965), or introducing neutral red into the cells (Häder & Burkart, 1983). In all these cases it has been found that a slug orientates away from the light, because light is prevented from focusing on the distal side, but instead illuminates the proximal side more, due to absorption.
It is not yet fully understood how the light signal is transformed into tactic behaviour. Bonner et al. (1988) argued that NH3 could play an important role in this process, because they found that, on the one hand, light causes slugs to produce NH3, whereas on the other hand, the response to light diminishes when the slugs are completely surrounded by NH3. Several authors have reported negative chemotaxis away from NH3, and have shown that the amount of NH3 produced by slugs is sufficient for such a motion (Feit & Sollitto, 1987; Yumura et al., 1992; Bonner et al., 1986; Kosugi & Inouye, 1989).
Francis (1964) suggested that light may speed up cell motion, and that this could be a sufficient explanation for phototaxis. This led to the hypothesis that light stimulates the local production of NH3, which, in turn, stimulates the cells to move faster, forcing the slug to turn towards the light (Bonner et al., 1988,1986). However, there is still a dispute about whether NH3 does indeed speed up cell motion, since more detailed studies reported that average slug speed may be unaffected by NH3 or light, and not even a transient increase could be detected (Fisher, 1997; Smith et al., 1982). Furthermore, Davies et al. (1993) did not find that NH3 caused any change in chemotaxis towards cAMP.
During phototaxis the trails of slugs belonging to certain mutant strains can become unstable, bi-directional (Fisher & Williams, 1981), or even multidirectional (Fisher et al., 1985). We specifically focus on the bi-directional mutants. At low light intensities their bi-directionality decreases, or even disappears (Poff et al., 1986). Moreover, even at high light intensities the trail of such mutants can be made more stable and to deviate less from the direction of light if activated charcoal is added to the substrate (Haser & Häder, 1992; Fisher & Williams, 1981). There are some indications that this reaction is related to the absorption of NH3 by the charcoal (Haser & Häder, 1992; Bonner et al., 1986). In general, slugs orientate towards a piece of charcoal, but if the charcoal is first saturated with NH3, it is no longer capable of attracting slugs (Bonner, 1993). This is yet another indication that the main effect of the charcoal is to absorb NH3.
In this paper we model phototaxis in terms of an NH3-mediated modification of the shape of cAMP waves only; no differences in chemotactic response were assumed. We show that this modification is sufficient to account not only for phototaxis, but also for a number of other behaviours which are observed in connection with phototaxis.
There have been several models describing slug migration (Williams et al., 1986; , ; Savill & Hogeweg, 1997; Umeda, 1989; Odell & Bonner, 1986, and chapter 3). However, these models were not used to describe phototaxis. In this study we have extended our model for thermotaxis (see chapter 3), a hybrid CA/PDE model, which was formulated by Savill & Hogeweg (1997) to describe the development from single cells to crawling slugs. In these hybrid models a CA is used to represent individual amoebae and light, and PDEs to model diffusible chemicals. The models are based on a special CA model-formalism, developed by Glazier & Graner (1993). The strength of this formalism is that amoebae are represented as a group of connected automata instead of point-like objects. Therefore amoebae can slide past one another and deform themselves and adjoining amoebae by means of small changes in their boundaries. Very recently, Jiang et al. (1998) have used the same formalism to describe tip formation during the mound stage of Dictyostelium.
In our previous study, on thermotaxis in Dictyostelium slugs, we showed that taxis can develop as a result of differences in the excitability of the amoebae. These differences in excitability cause the cAMP waves to change shape, which, via the chemotaxis towards cAMP, causes the slug to turn. We have made several extensions to our previous model: the CA has been extended with a description of irradiation and refraction, an extra PDE has been added to describe the NH3 dynamics, and the cAMP-modulated cAMP response has become dependent on the NH3 concentration. Since the relationship between NH3 and cell speed is still under dispute, we have decided to omit from our model any difference in chemotaxis between cell types or due to NH3.
We study phototaxis in two-dimensional (2D) slugs. This is not a limitation of our model, because Bonner (1998) has recently managed to develop an experimental method for producing migrating 2D (one cell thick) slugs which share most basic properties with normal three-dimensional (3D) slugs.
Each amoeba occupies about 30 automata in the CA, and has an
associated label ![]() , which indicates whether the cell type is
prespore, prestalk or oscillatory prestalk (
, which indicates whether the cell type is
prespore, prestalk or oscillatory prestalk (![]()
![]() {p, t, a}).
Each automaton that is part of an amoeba's boundary has a number of
dimensionless free energy bonds. The magnitude of these bonds depends
on the cell types they connect. The energy bonds are given by
J
{p, t, a}).
Each automaton that is part of an amoeba's boundary has a number of
dimensionless free energy bonds. The magnitude of these bonds depends
on the cell types they connect. The energy bonds are given by
J![]() ,
,![]() > 0, where
> 0, where ![]() are the types of the two
amoebae. The bond energy between an amoeba and the medium is given by
J
are the types of the two
amoebae. The bond energy between an amoeba and the medium is given by
J![]() , M. The total free energy of an amoeba is given by:
, M. The total free energy of an amoeba is given by:
H + + |
(4.1) |
We choose bond energies so that the amoebae adhere to each other, but also so that, if given the possibility, they will sort themselves into three fairly homogeneous groups. Oscillatory cells adhere together more rigidly than prestalk cells, and the latter adhere together more rigidly than prespore cells. For further details, see chapter 3.
The luminous intensity l is calculated using the ray-tracing technique. For some basics on ray-tracing, see, for example, Stavroudis (1972). In our computations, for every position along the upper border of the CA a ray is initiated, with a downwards ray direction. Light that enters or leaves a slug is refracted. First, one finds the point where the ray intersects the slug surface. At that point the normal to the surface is calculated: after assigning the value 0 or 1 to automata outside or inside the slug and taking the eight-neighbourhood into account, we compute the local gradient. The direction of the gradient is used as the surface normal. Knowing the surface normal and the angle of incidence, which is the angle between the incident ray and the surface normal, the direction of the refracted ray is determined using Snell's law. We use a refractive index of 1.369, which is the value of the refractive index for Dictyostelium, as measured by Häder & Burkart (1983). Next, one finds the point of intersection of the refracted ray with the slug surface, and so on. To map the ray, which can move not only horizontally and vertically, but in any direction, onto the discrete CA, we use Bresenham's line algorithm (Bresenham, 1965). To obtain the luminous intensity values at each point, we add up the intensities of all individual rays passing through it. By default, the intensity of an individual ray is set to 1, which we refer to as the default light intensity. To change the intensity of the light source, we simply change the intensities of the incoming rays.
Three PDEs are used to describe the cAMP and NH3 dynamics. The cAMP dynamics can be described reasonably well in a quantitative way by two variable simplified equations of the FitzHugh-Nagumo (FHN) type. For some basic background on FHN-type models we refer to Grindrod (1996). Such a description reproduces the overall characteristics of cAMP waves such as refractoriness and curvature relation. The main advantage of these models is their simplicity, and therefore their capacity to connect the effects visible in these models with basic properties of the cAMP signalling in Dictyostelium. FHN-type models are appropriate for a preliminary qualitative study of the behaviour, but, of course, are not adequate for a detailed quantitative study.
Here we investigate the basic effects of heterogeneity in excitability, but we are not concerned with the details of cAMP signalling. So for our present purposes, the FHN-models are preferred.
For this study we used the following equations, in which c
represents cAMP concentration, and r refractoriness of the
cells. The third PDE describes the NH3 concentration:
| = | Dc |
(4.2) | |
| = | |||
| = | Dn |
with
f (c,![]() , n) = C1c when c < c1;
f (c,
, n) = C1c when c < c1;
f (c,![]() , n) = - C2c + a(
, n) = - C2c + a(![]() , n)
when
c1
, n)
when
c1 ![]() c
c ![]() c2;
f (c,
c2;
f (c,![]() , n) = C3(c - 1) when c > c2, and
, n) = C3(c - 1) when c > c2, and
![]() (c) =
(c) = ![]() when c < c1;
when c < c1;
![]() (c) =
(c) = ![]() when
c1
when
c1 ![]() c
c ![]() c2, and
c2, and
![]() (c) =
(c) = ![]() when c > c2. To make the function
f (c,
when c > c2. To make the function
f (c,![]() , n) continuous,
c1 = a(
, n) continuous,
c1 = a(![]() , n)/(C1 + C2), and
c2 = (a(
, n)/(C1 + C2), and
c2 = (a(![]() , n) + C3)/(C2 + C3). If the luminous intensity is below
the threshold lth = 3, g(l )= 0, and if
l
, n) + C3)/(C2 + C3). If the luminous intensity is below
the threshold lth = 3, g(l )= 0, and if
l ![]() lth,
g(l )= l. The small decay
dnin is due to the
assimilation of NH3 into amino acids (Dunbar & Wheldrake, 1997). Dn
is much larger than Dc, due to the relatively low diffusion
coefficient of cAMP (Dworkin & Keller, 1977). Each automaton in the CA
is associated with one grid point in the discretised numerical PDEs.
lth,
g(l )= l. The small decay
dnin is due to the
assimilation of NH3 into amino acids (Dunbar & Wheldrake, 1997). Dn
is much larger than Dc, due to the relatively low diffusion
coefficient of cAMP (Dworkin & Keller, 1977). Each automaton in the CA
is associated with one grid point in the discretised numerical PDEs.
Weijer et al. (1984) showed that the tip of the slug can be seen as a
high-frequency pacemaker, whereas the body of the slug behaves as an
excitable medium. This can be modelled using parameter a(![]() , n),
which gives a stable limit cycle at negative values, and describes an
excitable medium at positive values. Therefore, positive values are
used to describe excitable amoebae, whereas negative values are used
to describe the oscillatory amoebae in the tip.
, n),
which gives a stable limit cycle at negative values, and describes an
excitable medium at positive values. Therefore, positive values are
used to describe excitable amoebae, whereas negative values are used
to describe the oscillatory amoebae in the tip.
Our description of NH3 action is based on the following experimental data. Schindler & Sussman (1979) found that NH3 inhibits the cAMP-induced cAMP release; Williams et al. (1984) established that this is because NH3 blocks intracellular cAMP accumulation by inhibiting the transitory activation of adenylate cyclase in response to the binding of extracellular cAMP to cell surface receptors; and Darcy & Fisher (1990) produced evidence that this inhibition of the cAMP signalling is important in slug behaviour.
Since in the model a(![]() , n) represents the threshold for the cAMP
response, we use the parameter a to express the inhibiting effect of
NH3 on the cAMP-modulated cAMP response. We do this by specifying
an NH3-dependent increase of a. We assume that this increase
saturates:
, n) represents the threshold for the cAMP
response, we use the parameter a to express the inhibiting effect of
NH3 on the cAMP-modulated cAMP response. We do this by specifying
an NH3-dependent increase of a. We assume that this increase
saturates:
Outside the amoebae we only implemented a small cAMP decay, dc,
caused by external phosphodiesterase, and when we modelled absorption
of NH3 by charcoal, we also implemented an NH3 decay
dnout:
Chemotaxis is incorporated in the model by using the spatial gradient
of the cAMP wavefront (Savill & Hogeweg, 1997):
![]() H
H![]() =
= ![]() H -
H - ![]() (cautomaton - cneighbour), where
(cautomaton - cneighbour), where
![]() H
H![]() is the new change in energy. This makes it more likely
that an amoeba will move towards a location with higher cAMP
concentration and less likely that it will move towards one with lower
cAMP concentration. Chemotaxis is only taken into account when cAMP is
above a threshold
cth = 0.05 and refractoriness below a threshold
rth = 0.2.
is the new change in energy. This makes it more likely
that an amoeba will move towards a location with higher cAMP
concentration and less likely that it will move towards one with lower
cAMP concentration. Chemotaxis is only taken into account when cAMP is
above a threshold
cth = 0.05 and refractoriness below a threshold
rth = 0.2.
Although the process of cell sorting already starts during the mound formation, slugs are still fully capable of generating the prestalk-prespore pattern due to cell sorting (Sternfeld & David, 1981). The first cells to sort out are the prestalk A cells, which form the tip and are the source of the cAMP waves (Williams et al., 1989; Siegert & Weijer, 1992). Therefore in all simulations a slug is initiated with a tip consisting of oscillatory prestalk cells. As a `worst case scenario' with respect to the cell sorting, the remaining prestalk cells, together with the prespore cells, are distributed randomly in the body of the slug. Please note, however, that slugs which have completed cell sorting show the same phototactic behaviour as slugs which are still in the process of cell sorting.
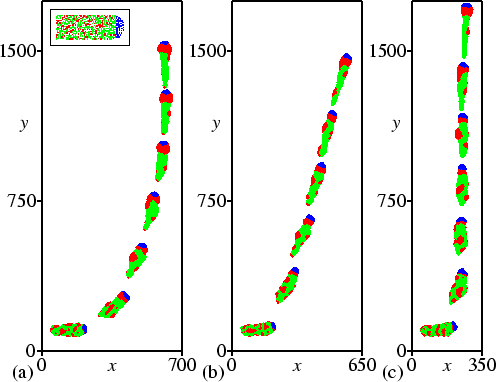
We were able to reproduce phototaxis in Dictyostelium discoideum. In Fig. 4.1 we demonstrate the phototactic behaviour of our model slugs in the form of a time-lapse image; Fig. 4.1(a) shows a simulation of phototaxis with light radiating from top to bottom. The inset shows the initial configuration. The oscillatory prestalk cells are coloured blue, the remaining prestalk cells red, and the prespore cells green1. Initially, the slug moves at an angle of 90 degrees relative to the light source, but after 2 hours 30 minutes the angle has decreased to 30 degrees. Within 7 hours the slug has turned completely towards the light. The differences in adhesion between the various cell types are important for the cell sorting (see chapter 3), but have little effect on the phototactic behaviour.
 |
In Fig. 4.2 the experiments are quantified, each plot showing the slug trails from 32 different simulations. All lines start at the same initial position (0,0), which is visible as a node where all lines originate. Every plot is based on 16 different initial orientations, at intervals of 22.5 degrees.
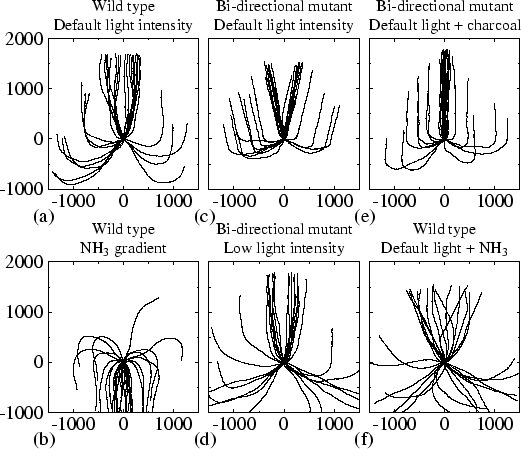 |
Figure 4.2(a) shows normal phototaxis. The final orientation is independent of the initial angle, i.e. in the end the direction of motion is always towards the light. However, when the initial angle is larger than 90 degrees, turning of the model slug is initially slow.
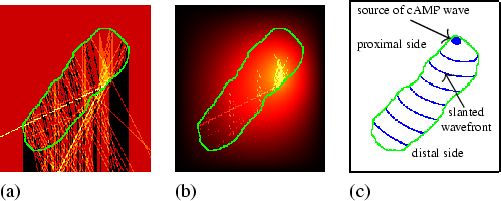
The mechanism of phototaxis can be described as follows. As a result of the lens-effect, the light is focused on the distal side, as can be seen in Fig. 4.3(a), which shows the distribution of the luminous intensity. Figure 4.3(b) shows the corresponding NH3 concentration. Note that although in a snapshot of the luminous intensity discrete effects are clearly visible, these do not affect the long-term behaviour, because the slugs' boundary is continuously changing its shape, therewith constantly changing the luminous intensity distribution. Because NH3 inhibits cAMP it causes a longer oscillating period and a lower wave speed in the region of high NH3 concentration (see chapter 3). Hence a region with the shortest oscillating period will be located on the proximal side, which will serve as the source of the cAMP waves [see Fig. 4.3(c)].
 |
Hence the cAMP wave starts slanted, and remains slanted when it passes through the region where the light is focused, because in this region there are large differences in NH3 concentration (and thus in wave speed) between the proximal and distal side. More posteriorly there are only small variations in the NH3 concentration, and as a consequence the cAMP wave straightens out due to the curvature-effect [see Fig. 4.3(c)]. The slanted cAMP wave, combined with the chemotaxis towards cAMP, leads to the phototactic response: the amoebae move preferably perpendicular to the wavefront therewith pushing the oscillatory tip into the direction of the light source.
Our model also reproduces the experimentally observed negative taxis away from NH3. Figure 4.2(b) shows the trails of 32 simulations in a field with the source of NH3 located at the top, without any light. The negative chemotaxis is clearly visible. Note that individual amoebae in our model do not have any NH3 taxis. The mechanism is simply that the NH3 partly diffuses into the slug and causes an internal NH3 gradient. This again gives rise to the differences in excitability which lead to the tactic behaviour.
Our model reproduces a deviation in the orientation towards light, similar to what is observed in the so-called bi-directional mutants. We found this behaviour when the decrease in excitability saturates at higher NH3 concentrations. Figure 4.1(b) shows a simulation in which we increased the value of p (which gives the half-saturation concentration) four times. The slug still demonstrates pronounced phototaxis, but the final direction of motion is at an angle of 14 degrees. Figure 4.2(c) shows the trails of 32 different simulations. This figure clearly shows bi-directional phototaxis. Initially, turning can be slow, but the final deviation from the direction of the light path is independent of the initial angle. If initially the slug is positioned at an angle of zero degrees, random variations are amplified by up to 14 degrees.
In our model and in experiment, bi-directional phototaxis changes back into unidirectional phototaxis at low light intensities (Poff et al., 1986). Figure 4.2(d) shows the trails of the `bi-directional mutant' from the previous simulations when the light intensity is decreased from 1 to 0.8. Now turning takes much longer and the trails are less stable, because the signal is weaker. However, bi-directionality has indeed disappeared. At light intensities stronger than 0.8 bi-directionality can still be observed, though it is weaker; at weaker light intensities phototaxis becomes increasingly less pronounced.
From experiments it is known that charcoal reduces the deviation in slugs' orientation towards light. We found similar results in our model. Figure 4.1(c) shows such a simulation, in which the bi-directional mutant is surrounded by charcoal. We emulated the addition of charcoal by including the external absorption of NH3 in eqn (4.5). The slug moves straight to the light, and the bi-directional behaviour has disappeared. Figure 4.2(e) shows again that this result does not depend on the initial conditions. Even when the initial angle is 180 degrees, random deviations let the slug turn either to the right or the left.
The mechanism of bi-directional phototaxis can be explained as follows. In eqn (4.3), parameter p gives the NH3 concentration at which the decrease in excitability is half-saturated, and thereby determines the range of NH3 concentrations that affect the excitability. If this parameter is increased (and hence the range is enlarged), differences in excitability along the slug become larger. These differences are locally largest between the area on which the light is focused and the area on the other, more excitable proximal side. The source of the cAMP wave hardly changes position at all, because this location is determined mainly by the lowest NH3 concentration. However, when the wave reaches the region on which the light is focused, the wave shape changes dramatically, as it moves much more slowly in the region of the light focus on the distal side of the slug than on the proximal side. As a result, the wave becomes much more slanted in this region than is found with normal phototaxis.
The model does not contain explicit forces. However, the adhesion between the amoebae and between the amoebae and the medium create a surface tension (Glazier & Graner, 1993), which preserves to a certain extent the shape of the slug. Therefore the chemotactic motion can create force on the slug itself, which has a torque, due to the slanted wavefront. Since the wave is only substantially slanted at a certain distance behind the tip, the oscillatory area is pushed away from the light by the momentum of this force. This is especially the case when the slug moves at a small angle to the direction of light: the light is focused on an area that is located at a larger distance behind the tip, which creates a longer lever. Hence, at small angles the bi-directional mutant moves away from the light. Note that the effect is caused by differences in motion direction and not by differences in motion speed. In fact, when following individual amoebae, we observe rather wriggling paths of motion. Only the gross activity shows the fixed bi-directional motion.
The absorption by charcoal decreases the NH3 concentration. This has only a marginal effect on the position with the lowest concentration and thus on the source of the new cAMP wave, but reduces the slant of the cAMP wave and thereby the momentum of the force sufficiently to re-establish unidirectional phototaxis. The effect of decreasing the light intensity works via the same principle as the addition of charcoal, namely it creates lower NH3 concentrations. The main difference between low light intensity and adding charcoal is that at low light intensities the signal becomes weaker, which causes slower turning and more unstable trails, whereas when charcoal is added the signal remains strong, and therefore, stability and turning velocity are still very high.
In our last simulations we considered the experimental observation that external NH3 decreases phototaxis. Figure 4.2(f) shows the trails of our original unidirectional phototactic slug when surrounded by an NH3 concentration of 2.0. Obviously, phototaxis diminishes, because the high concentration of NH3 strongly interferes with the phototactic signalling system. However, very high concentrations are needed to suppress phototaxis completely, since it is driven by relative differences in NH3 concentration, and not by absolute values.
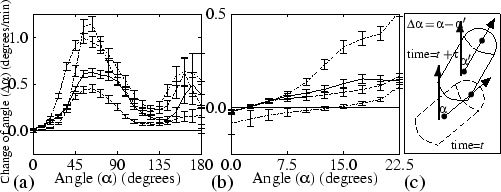
Next, using the data from Fig. 4.2, we analysed the velocity at which slugs turn towards the light. Figure 4.4(a) shows the change of angle versus the angle by which the slug deviates from the light source. Figure 4.4(b) gives a more detailed graph of the change of angle between 0 degrees and 22.5 degrees. To obtain the figure, we took into account that this turning is, to the left and right, symmetric around the direction of the light path. For normal phototaxis, there is only one stable direction of motion, namely towards the light source. The bi-directional mutant turns much faster, since its sensitivity to NH3 is much higher, but the phototactic force towards the light and the momentum of the force away from the light equilibrate at an angle of 14 degrees, which is clearly visible in Fig. 4.4(b). At low light intensity the turning velocity of the mutant is much lower again, but, as can be seen in Fig. 4.4(b), the final direction is towards the light source. When the mutant is surrounded by charcoal, its turning velocity is lowered only slightly, but motion towards the light is again the only stable solution.
 |
When the initial angle is larger than 90 degrees, little light is focused on the distal side. However, some light is still focused on this side every time a cAMP wave passes through the slug, because chemotaxis towards cAMP causes the slugs' boundary to become temporarily lenticular. This light causes slow but steady turning. When the angle becomes less than 90 degrees, the tip acts as a lens all the time, so the slug turns much faster. We find that especially around 135 degrees turning occurs very slowly. This creates the optical impression that these angles also represent stable solutions [see, for example, Fig. 4.2(c)].
In all our simulations we used a tip consisting of oscillatory amoebae, while the rest of the slug only relayed the signal. However, the change in excitability might be much more gradual, with at least all prestalk cells in the oscillatory regime (Dormann et al., 1996; Siegert & Weijer, 1992). Therefore we performed a number of control experiments, in which all prestalk cells were oscillatory, although the tip cells were still the most excitable ones ( a0t = - 0.05). All other conditions were kept the same. This caused no qualitative differences in any of the the model behaviours: the high-frequency oscillations in the tip enforced the global cAMP dynamics.
Another assumption we made is that both cAMP and NH3 can freely diffuse in and out of the slug. For NH3, a volatile gas, this assumption is very reasonable, but for cAMP it is less clear what would be the correct boundary conditions. Therefore we also tested if our results depend on a specific choice of the boundary conditions. We repeated our experiments using Neumann boundaries, i.e. as if the slugs' boundary is impermeable to cAMP. We found that it does not affect the phototactic behaviour. However, the shape of the slug is less well preserved.
We have described a mechanism that can explain phototaxis in Dictyostelium discoideum, including its bi-directional mutants. Previously proposed mechanisms, such as phototaxis due to an increase in the speed of the amoebae in the illuminated region of the slug (Bonner et al., 1988), or bi-directionality due to actively turning towards and away from the light to correct the deviation from the preferred direction of motion (Fisher, 1997), are shown to be superfluous: all the experimental data can be explained by our mechanism, which uses only light focusing, NH3 production, modification of the cAMP wave, and chemotactic motion.
The relative contributions to the phototactic behaviour of (i) the shift in the source of the cAMP waves towards the light, and (ii) the wave shape deformation, are difficult to discriminate because these properties both emerge from the local rules and hence can never be completely separated. For example, the velocity by which the cAMP wave moves away from a certain position affects the oscillating period and therewith the source of the new cAMP wave. However, both processes contribute to the phototaxis because if the wave does not start slanted, side-effects as described for bi-directional mutants are found, whereas without differences in wave propagation the wavefront restores itself too quickly and little directed motion is created.
During the slug stage chemotactic motion towards cAMP is hard to
observe. However, there are many indications that slug motion is still
driven by cAMP waves (Dormann et al., 1998). In our model we observe
that amoeboid motion is not restricted to the actual location of the
cAMP wave, but is spread out over large distances due to pushing and
pulling. Especially when chemotaxis is relatively weak (e.g.
![]() =100), a global and continuous motion is observed, in which
responses to individual cAMP waves can not be distinguished. This
behaviour is very comparable with what is observed by
Bonner (1998) in migrating 2D slugs. Note, however, that the
behaviour is still driven by periodical cAMP waves.
=100), a global and continuous motion is observed, in which
responses to individual cAMP waves can not be distinguished. This
behaviour is very comparable with what is observed by
Bonner (1998) in migrating 2D slugs. Note, however, that the
behaviour is still driven by periodical cAMP waves.
In contrast to our previous model which used a linear gradient of excitability, to mimic thermotaxis, the gradient in this study is dynamic and highly nonlinear. This is due to the light focusing which changes all the time during slug motion, and also to the NH3 dynamics. Nevertheless, the mechanism accounts for all aspects of phototactic behaviour.
According to our model, in the first instance light information is encoded using NH3. In the previous study we assumed a similar mechanism for the thermal information. So we propose that thermotactic and phototactic information converge at a very low level, before or while converging with the NH3 signalling. This is in agreement with Fisher (1997), who showed in a review of phototaxis research, that thermotactic mutants are seldom found with unaffected phototaxis or vice versa, and thus information integration must occur at a very early stage.
We stated earlier that individual amoebae are not able to measure the direction of irradiation. Instead, the whole slug encodes differences in luminous intensity as differences in NH3 concentration. The NH3 changes the local excitability and hence the shape of the cAMP wave. It is the chemotaxis towards the cAMP wave which in the end induces the turning of the slug.
Fisher (1991) objects to the idea that NH3 is the substance important for phototaxis, because is his view the NH3 gradient in the open air would be too low to be measured, being flattened by the very high diffusion coefficient. However, the local NH3 gradient is not measured by the amoebae either, and in our model only global concentration differences are necessary. The only gradient measured is the cAMP gradient, which is very steep due to its pulsatile nature and therefore relatively easily measurable. Obviously, no chemical could ever have such a steep steady-state gradient.
Another effect NH3 could have on the amoebae is increasing the locomotive speed; however, there is a fair amount of dispute on this subject because some studies indicate that it does (van Duijn & Inouye, 1991; Bonner et al., 1986), and other studies indicate that it does not (Fisher, 1997; Smith et al., 1982). Besides, other chemicals such as O2 could also be able to speed up the motion (Bonner et al., 1995). We did not include such modifications of the locomotive speed in our model, and show that locomotive differences (whether they occur or not) are not needed for phototaxis.
Neither did we include an explicit difference in chemotaxis between the cell types, although Siegert & Weijer (1992) have shown that prestalk cells move faster than prespore cells. Nevertheless, such a difference in motility emerges in our model, solely due to differential adhesion.
Fisher (1997) proposed that with phototaxis slugs always move at a certain angle to the direction of light, but that in the case of the wild type this angle would be just too small to be measurable. Instead, we find that bi-directional phototaxis occurs when NH3 sensitivity is too high. We did not implement different mechanisms for positive and negative phototaxis, but we found that both emerged from our model as an effect of the turning mechanism, negative phototaxis being caused by the slanted wavefront at a certain distance behind the tip. Thus we predict that it will in fact be fruitless to search for the ``direction-dependent sign reversal in slug behaviour'' which makes ``slugs that travel more directly towards the light correct their error with a turn away from the light'' (Fisher, 1997).
Another observation that can be clarified by our model is that when slugs are formed at high cell density, bi-directional phototaxis becomes more extreme (Fisher & Williams, 1981). At high cell density NH3 concentrations will become higher, and, as a result, the bi-directionality will be stronger.
Besides NH3, there is another chemical, called Slug Turning Factor (STF), that plays a role in the process of phototaxis (Fisher, 1997). We did not include this substance in our model for reasons of simplicity, but the effect of STF may be similar to that of NH3.
The multidirectional phototaxis found by Fisher et al. (1985) may have been caused by a very low mean turning velocity at certain angles [see, for example, Fig. 4.4(a)]. With such low turning rates, a circular histogram with multiple preferred directions will be found, as well as (when individual measurements are plotted) groups of data clustered close to a zero change of angle (as presented by Fisher et al., 1985).
Other tactic behaviours of the slug can also be interpreted in terms of the same mechanism as that presented in this paper. First, Bonner et al. (1985) observed that migrating slugs tend to migrate towards the acid side of a pH gradient. This so-called acidotaxis, which is weak compared to phototaxis or thermotaxis, is most probably caused by a change in the NH3/NH4+ ratio (Bonner et al., 1985; Schindler & Sussman, 1979; Bonner et al., 1986). A low pH value decreases this ratio; hence a pH gradient will coincide with an NH3 gradient. If NH3, and not NH4+, is the active substance able to decrease excitability, then acidotaxis becomes directly comparable with the negative chemotaxis away from NH3 as described earlier. Secondly, Haser & Häder (1992) found rheotaxis: slugs orientate themselves in an air stream. This also fits into our model because the NH3 concentration will be lower on the proximal side. The same reasoning also holds for the observed motion towards a piece of charcoal provided it is not saturated with NH3. Finally, migrating slugs repel each other (Kosugi & Inouye, 1989), rising fruiting bodies orientate away from each other (Bonner & Dodd, 1962) and this orientation is affected by NH3 (Feit & Sollitto, 1987). Once again, higher NH3 concentrations between the slugs or fruiting bodies, produced by the slugs themselves, could account for this behaviour.
Although all behaviours can be explained by one basic mechanism, they all work together to ensure that the final fruiting takes place in a favourable environment: they let the slugs move towards the soil surface and fruit at regular spatial intervals.
Our study shows that a whole set of previously described phototactic behaviours can be explained solely with differences in NH3 concentration, which are caused by differences in luminous intensity, and which cause alterations of the excitability. The model predicts that no 3D properties are needed for phototactic behaviour. The behaviour of the simulated 2D slugs is strikingly similar to that of the experimental 2D slugs of Bonner (1998), and both resemble the behaviour of 3D slugs closely. We predict that phototaxis by wild type and mutants can also be observed in experimental 2D slugs. The motion of individual cells can be followed in the simulations and also in the above mentioned experiments. Our simulations make strong predictions about the directions of motion during phototaxis of individual amoebae of the wild type and mutants.
The specific form of the tip, as normally observed in migrating slugs, is neither found in our simulations, nor in the experiments of Bonner (1998). Indeed, Siegert & Weijer (1992) showed that the tip is organised by 3D scroll waves. Hence we predict that the specific form of the tip is a 3D property, which cannot occur in 2D slugs. However, we have demonstrated that this is not essential for the behaviour studied here. We therefore predict that the thin elongated tip is less of an organising centre than has been previously proposed.
 ,
,

