Next: 5. How Slime Moulds Self-Organise
Up: II. Morphogenesis of Dictyostelium discoideum
Previous: 4. Phototaxis
Contents
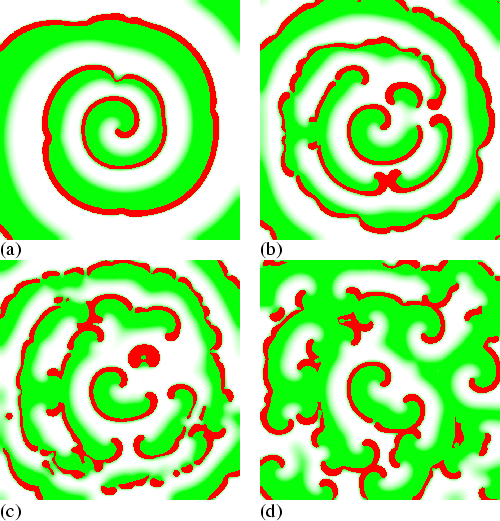
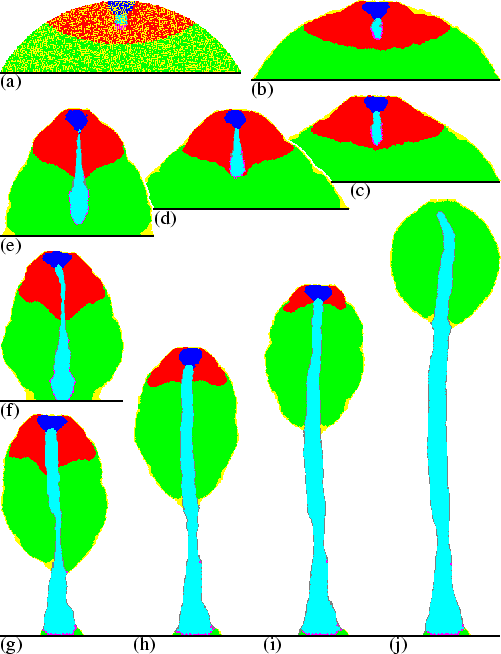
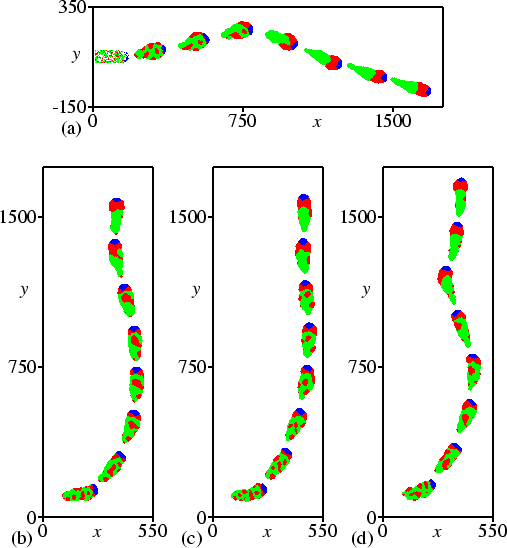
Figure 3.2
(a):
(b):
(c):
(d):
 |
Next: 5. How Slime Moulds Self-Organise
Up: II. Morphogenesis of Dictyostelium discoideum
Previous: 4. Phototaxis
Contents